HOME
ABOUT
LINKS
PRODUCTS
> MAPS
> SOUNDINGS
> GRIDDED
> X-SECTIONS
> SATELLITE
> SURGE INDEX
> LS FORCING
PUBLICATIONS
| North American Monsoon Experiment CSU Mesoscale Dynamics Group |
ANNOUNCEMENTS:
- A substantial dry bias was identified at many sounding sites within the T1A domain of NAME. Soundings have been corrected and gridded products regenerated. See Ciesielski et al. 2009 under PUBLICATIONS for more information.
- V2.0 of the surface gridded datasets was released 23 Mar 2009 (see the GRIDDED link to the left).
- V3.1 of the upper-air gridded datasets was released 23 Mar 2009. This version was created using humidity corrected soundings within the T1A region (see the GRIDDED link to the left).
- V3.1 of QCd sonde data was released 11 Mar 2009. This version includes humidity corrections (see the SOUNDINGS link to the left).
- A NAME-related publication list was added (see the PUBLICATIONS link to the left).
- V3.1 of large-scale forcing dataset was released on 21 August 2008. This version uses humidity corrected sounding data and pibal data to construct gridded analyses upon which forcing fields and EBA averages are based (see the LS FORCING link to the left).
- QCd 5mb sonde dataset V2.0 was released 1 Sept 2005. This version contains no humidity corrections (see the SOUNDINGS link to the left).
Horizontal maps, skew-t's, and cross-section products are available for the Enhanced Observing Period (EOP) of NAME from 1 July through 15 August 2004. These products were generated using the field-phase version (v1.0) of the sonde dataset. In addition, satellite and surge index products are available through the end of September 2004.
| SAMPLES OF AVAILABLE PRODUCTS | |
700hPa STREAMLINES & RH |
SKEW-T LOG-P DIAGRAM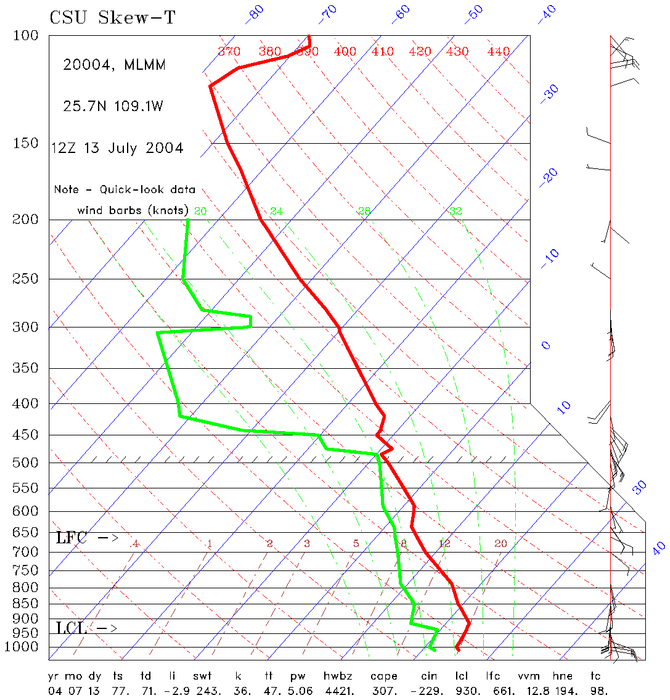 |
CROSS-SECTION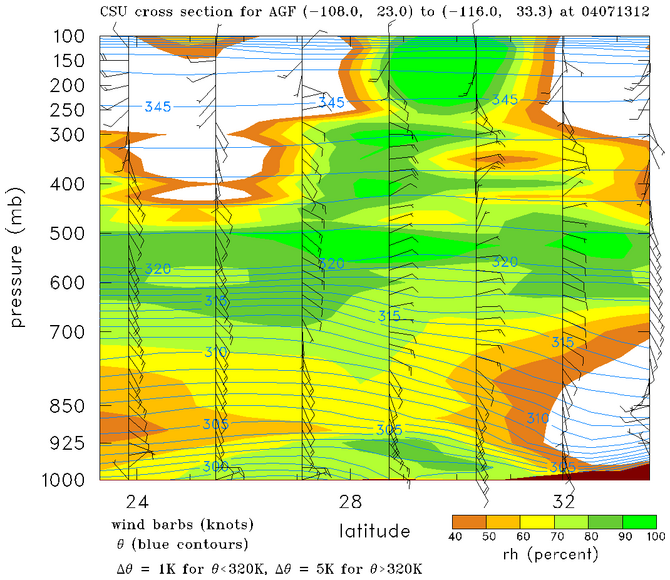 |
WIND VECTORS OVER OCEAN |
|
11 Mar 2020 13:11 MDT |
Dick Johnson johnson@atmos.colostate.edu 970-491-8321 |
Paul Ciesielski paulc@atmos.colostate.edu 970-491-8252 |
Brian McNoldy mcnoldy@atmos.colostate.edu 970-491-8558 |
| Research funded by NSF/NAME Grant # ATM-0340602 | |||