

Fiure 2. Time series of omega (mb/hour) averaged over the IFA for the TOGA COARE IOP (11/01/92 - 02/28/93) deduced from analyzed sounding data. Cool (warm) shades depict periods and regions of upward (downward) motion. Data have been smoothed with a 5-day running mean filter. Lite solid line near 5 km denotes the location of the freezing level.
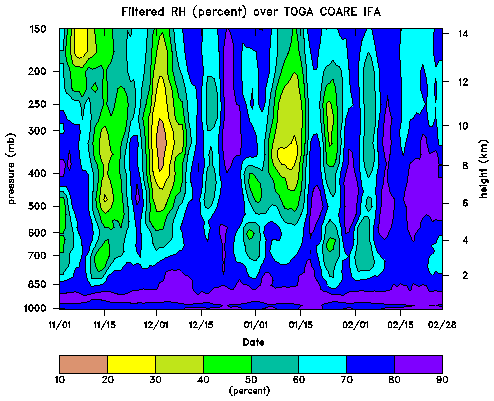
Fiure 3. Time series of relative humidity (percent) averaged over the IFA for the TOGA COARE IOP (11/01/92 - 02/28/93) deduced from analyzed sounding data. Cool (warm) shades depict moist (dry) periods and regions. Humidities were computed with respect to water at T's > 0C, and with respect to ice at T's < 0C. Data have been smoothed with a 5-day running mean filter. Lite solid line near 5 km denotes the location of the freezing level.
Fiure 4. Time series of equivalent potential temperatute (K) averaged over the IFA for the TOGA COARE IOP (11/01/92 - 02/28/93) deduced from analyzed sounding data. Cool (warm) shades depict periods and regions of low (high) equivalent potential temperature. Data have been smoothed with a 5-day running mean filter. Lite solid line near 5 km denotes the location of the freezing level.
Fiure 5. Time series of temperature lapse rate (K/km) averaged over the IFA for the TOGA COARE IOP (11/01/92 - 02/28/93) deduced from analyzed sounding data. Cool (warm) shades depict periods and regions of low (high) stability. Note three levels or higher stability: near 800 mb (associated the trade inversion), near 550 mb (or the freezing level, associated with the effects of melting) and near the tropopause. Data have been smoothed with a 5-day running mean filter. Lite solid line near 5 km denotes the location of the freezing level.
 Back
Back