Visual inventory of BOMEX upper-air sounding data

-
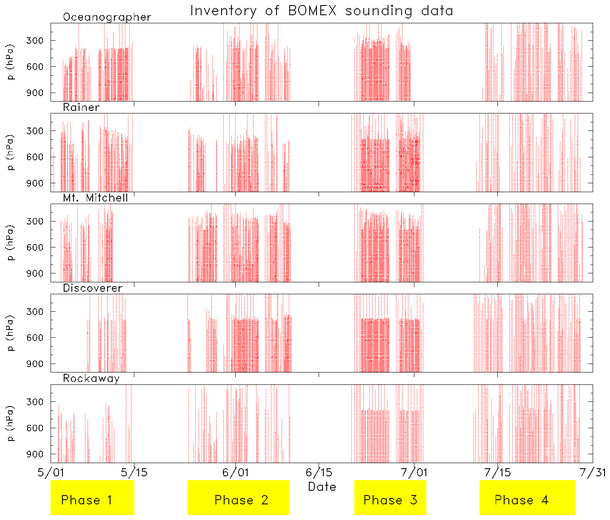
Visual inventory of BOMEX upper-air sounding data from five research vessels during the period 1 May
to 31 July 1969. Timing of four BOMEX phases are denoted with yellow boxes near bottom of the plot.
Each red line represents the presence of sonde data at that site and at that time. The lines are
comprised of individual dots depicting the vertical resolution and vertical extent of the data.
Current inventory does not include dropsonde data.
|
|
|


 Back
Back